One service, two faces
Mizelum is a service written in Rust, running on a PC or server, in a container if you like. It asks the hubs and keeps the history, and you see your sensors in a terminal or in a browser, on that computer or any other that can reach it. Both are first-class: what one can do, the other can.
The terminal interface
Four menus, a key each: sensors, hubs, network, config. A list of sensors beside the selected one in full, with its status, condition, graph and events, and the whole network as a tree. It is one small program for Linux that connects to the service, so it works from any computer on your network, or over SSH.
mizelum-cli
a screen as the program draws itThis screen is real: it is what the terminal interface drew, connected to the service watching its simulated hub, which has one of every device.
The dashboard
The same four menus as an instrument panel: readouts, gauges, status lights and a history graph from an hour to thirty days. Every sensor can have its own name, colour, theme and gauge, and the network is drawn as a live graph, from each sensor through its hub to Mizelum and the MQTT broker.
Reading
Themes
how instruments are drawn- DigitalSeven-segment readouts and segmented bars on dark screens. The default.
- AnalogMoving-needle meters on a cream face in a brass bezel.
- VintageNixie tubes: each digit glowing in its own glass tube.
- PlainThe same instruments drawn flat, with no glow and no scan lines.
Gauges
which instrument shows a reading- Numberthe value, written the theme's way
- Diala needle over a numbered arc
- Arca round arc that fills up to the value
- Bara bar that fills along a scale
- Columnthe same standing up, like a thermometer
- Trendthe number over a trace of its last hour
Any gauge works in any theme. This site is drawn in the digital one.
Network
the dashboard's network menu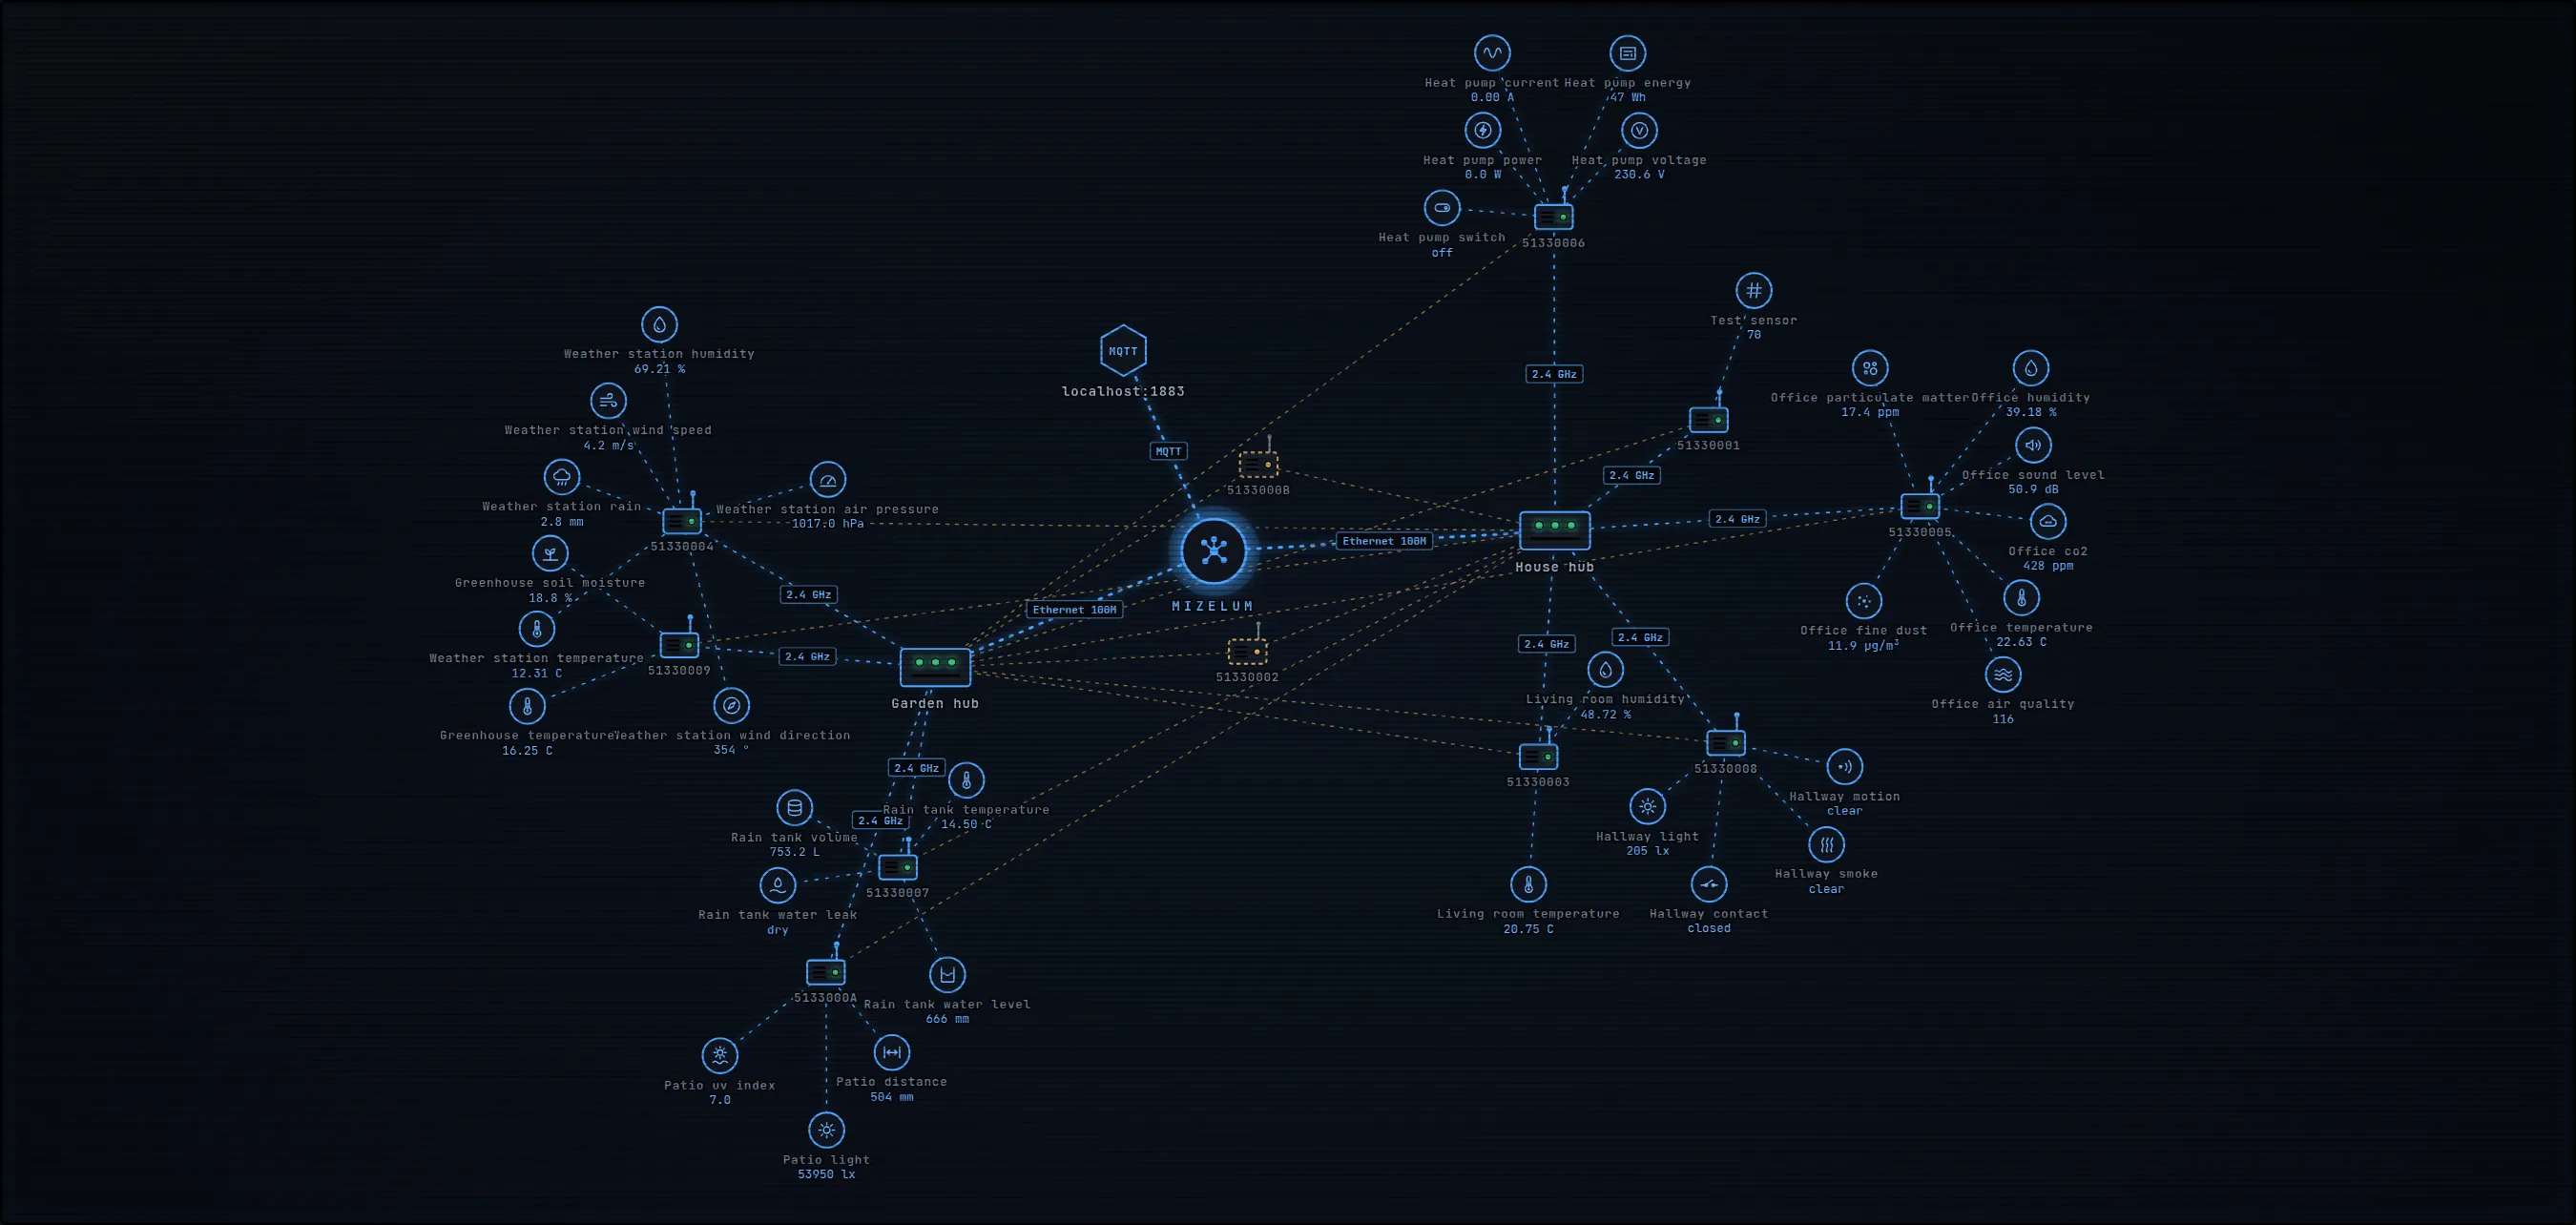
This picture is real: the dashboard drawing two simulated hubs and a stand-in MQTT broker. Moving dashes show readings on their way in; the dashed amber lines are devices a hub hears but another owns, or that wait to be accepted.
The service
mizelum serve runs in the background. It polls the hubs, stores every reading and every event in a SQLite database, and serves an HTTP API with a live stream. The dashboard and the terminal interface are two users of that API; yours can be another.
Try it without hardware
mizelum sim-hub          # a simulated hub
mizelum sim-hub 127.0.0.1:7738 --lora   # or a bridge base (LoRa)
mizelum serve            # the service
mizelum-cli 127.0.0.1    # the terminal interface
Good to know
- Only the service asks the hubs; the terminal interface and the dashboard show what it knows.
- The API can require an access token: one shared secret, no user accounts yet. It listens only on the PC it runs on unless you open it up.
- Settings are Mizelum's own: there is no way yet to change a hub or a sensor from it.